Introduction
Accessing Financial Report
Uploading Data Files
Setting Analysis Objectives
Configuring Report Options
Starting the Analysis
Accessing Your Generated Report
Sharing Reports with Stakeholders
Providing Feedback and Requesting Regeneration
Common Use Cases
Best Practices
FAQ
Verifi's Financial Report feature transforms your financial data into professional management reports for board meetings, management reviews, and strategic planning.
Key Capabilities:
Upload any financial data (ERP exports, trial balances, P&L statements)
Define custom analysis objectives or select from templates
Generate documentation sites and PowerPoint presentations
Choose Executive or Comprehensive detail levels
Support for English, Danish, and Swedish
Prerequisites: You must have Verifi installed in your e-conomic system. See the Verifi Onboarding Guide.
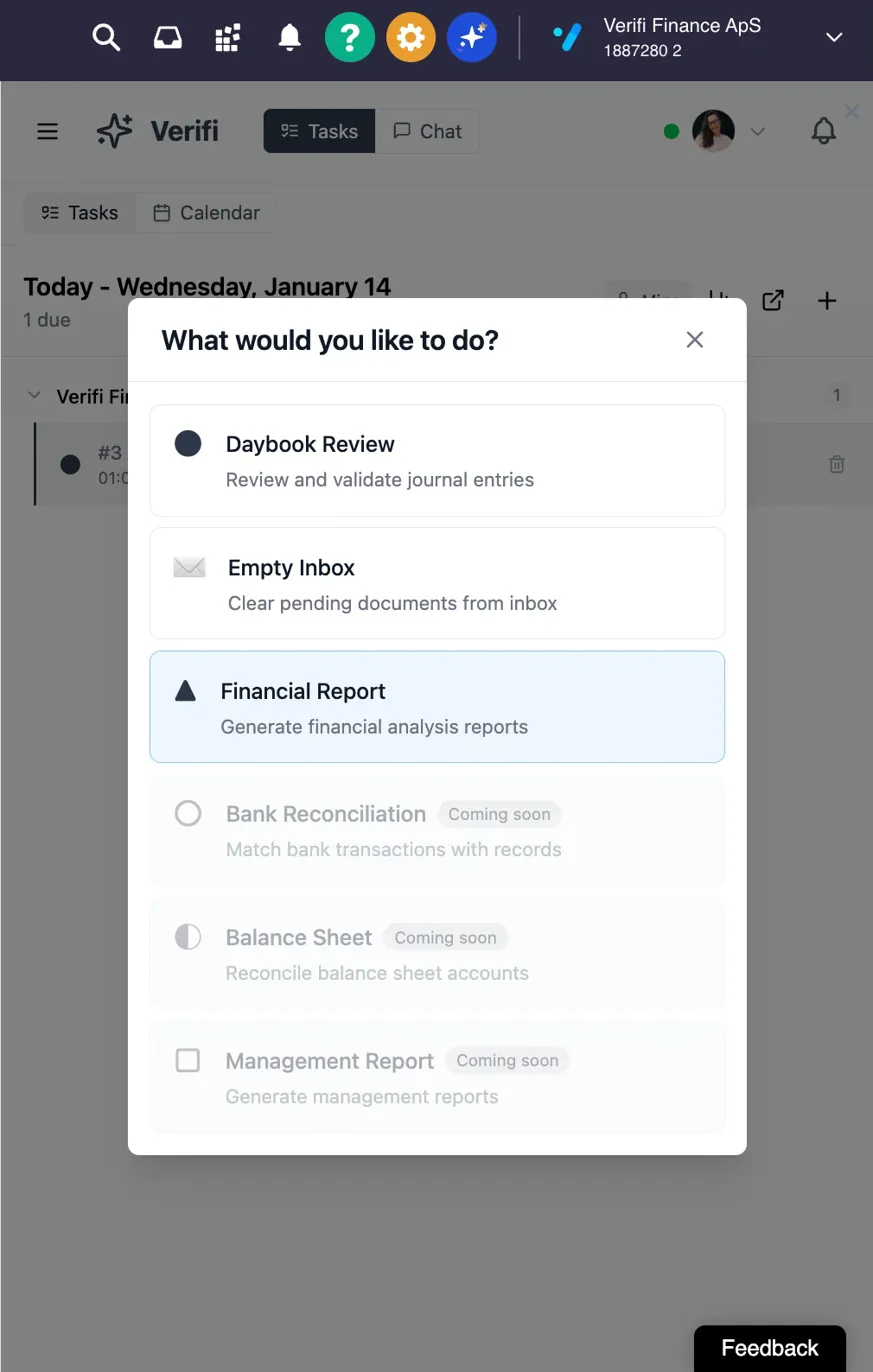
Open Verifi in your e-conomic system
Click to open the "What would you like to do?" modal
Select "Financial Report"
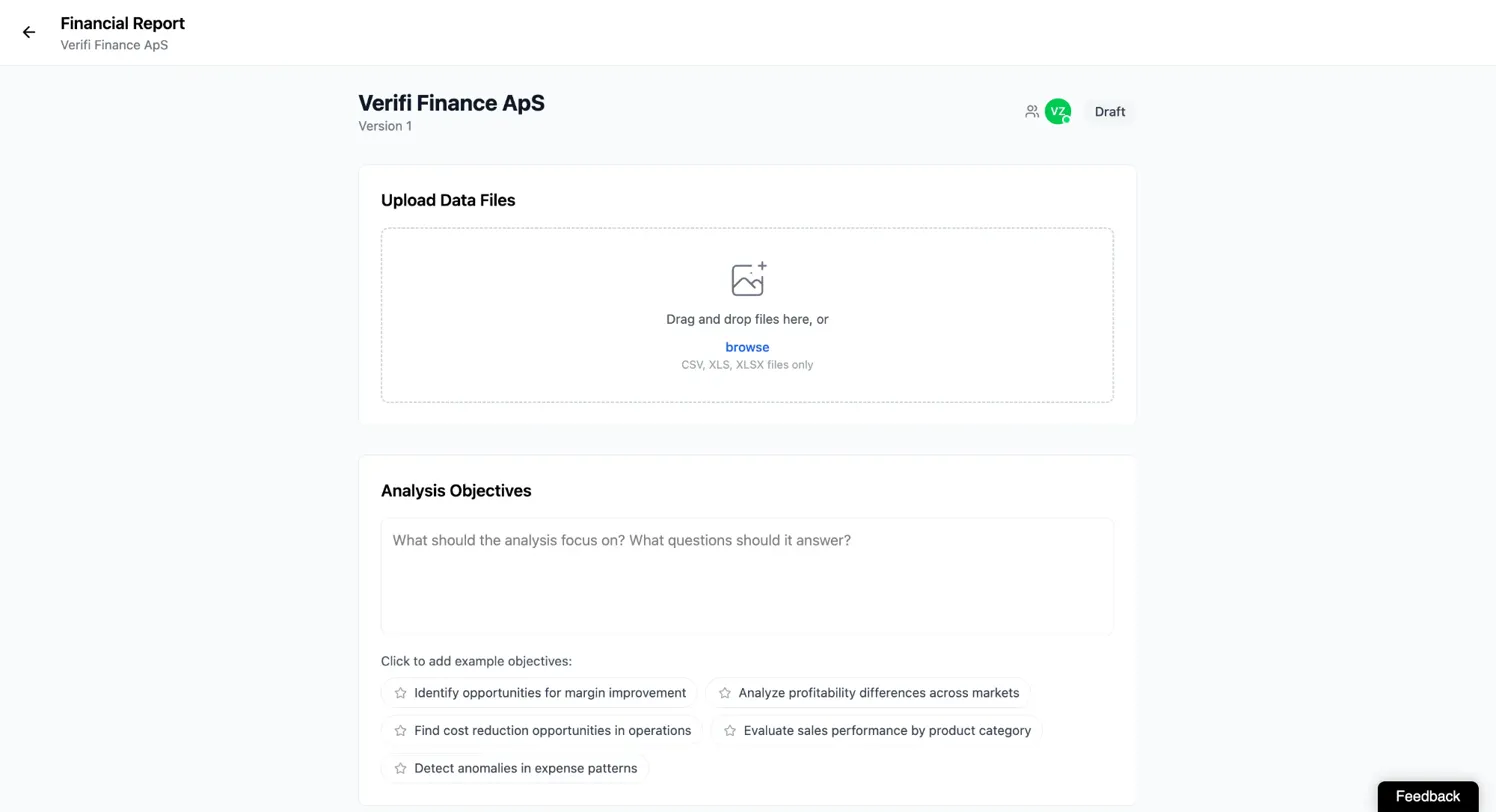
Supported Formats: CSV, XLS, XLSX
What to Upload:
ERP exports (trial balance, general ledger, transaction histories)
Financial statements (P&L, balance sheets, cash flow)
Operational data (sales by product/region, expense reports)
Analysis data (year-over-year comparisons, budget vs. actual)
Upload Methods:
Drag and drop files into the upload area
Click "browse" to select files from your computer
Multiple files can be uploaded simultaneously
No file size limits or validation. Ensure your data is clean with consistent formatting and clear column headers.
Analysis objectives guide the AI in understanding what insights you need from your data.
Using Example Objectives:
Click pre-built examples that align with your needs:
Identify opportunities for margin improvement
Analyze profitability differences across markets
Find cost reduction opportunities in operations
Evaluate sales performance by product category
Detect anomalies in expense patterns
Writing Custom Objectives:
Be specific about what you want to understand:
"Compare Q4 2024 revenue performance against Q4 2023, identifying drivers of growth or decline."
"Analyze gross margin trends by product line over the past 12 months and highlight lines requiring attention."
"Identify which expense categories exceeded budget in 2024 and recommend corrective actions."
Best Approach: Combine example objectives with 2-3 custom objectives specific to your needs. Aim for 3-5 total objectives.
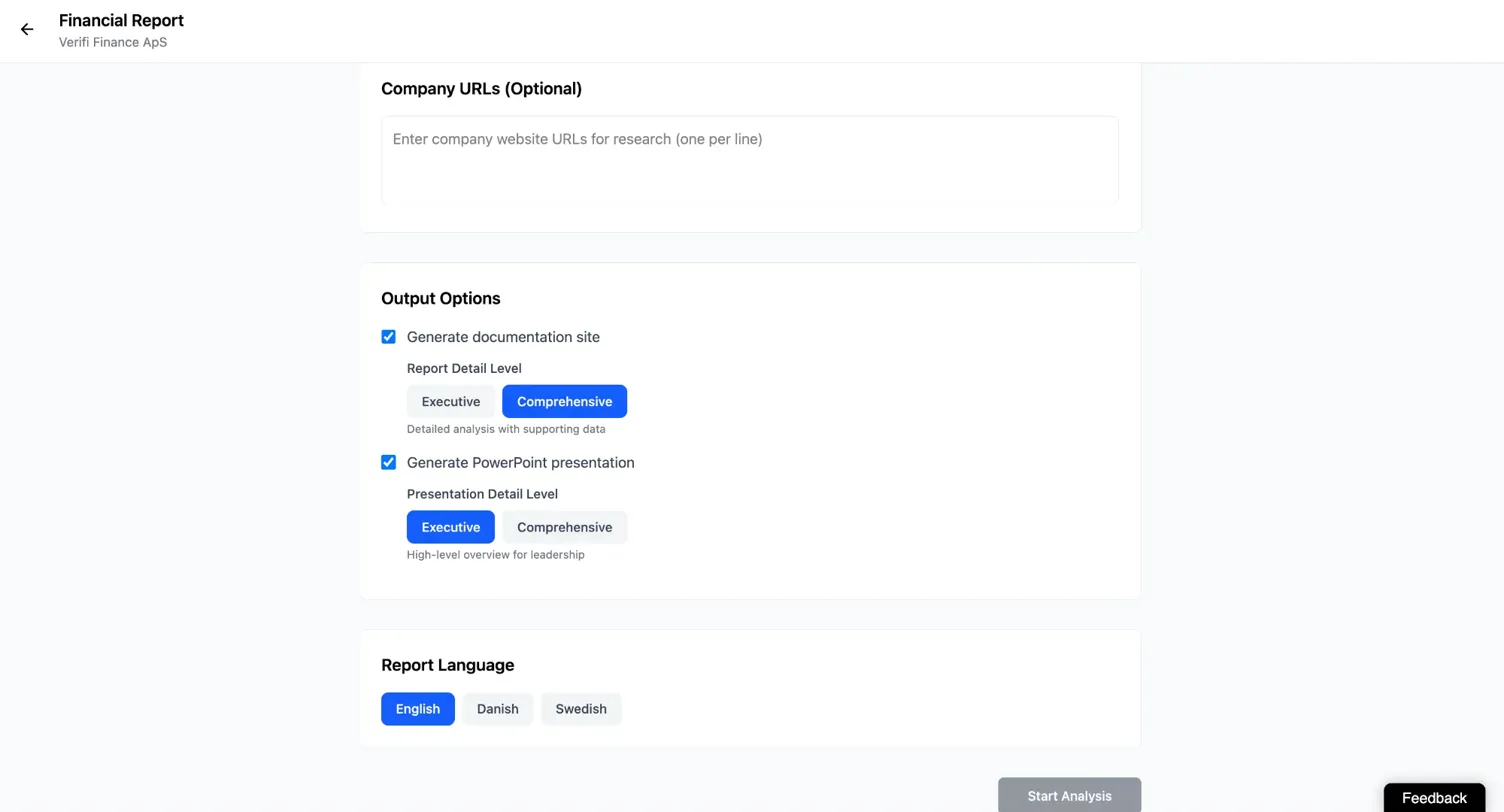
Add company website URLs (one per line) to enable the AI to research industry context and provide more informed recommendations. This field is optional.
Documentation Site:
Interactive web-based report accessible via URL
Choose Executive (high-level summary) or Comprehensive (detailed analysis)
PowerPoint Presentation:
Downloadable slide deck
Choose Executive (10-15 slides) or Comprehensive (20-30+ slides)
Recommended Configurations:
Board meetings: Executive documentation + Executive PowerPoint
Management reviews: Comprehensive documentation + Executive PowerPoint
Finance team analysis: Comprehensive documentation + Comprehensive PowerPoint
Review your configuration and click the "Start Analysis" button.
Processing Time: 20-30 minutes
During processing, you can:
Continue working in other Verifi features
Perform normal e-conomic tasks
Navigate away or close your browser
Check back after 20-30 minutes for your report link.
When ready, Verifi displays a link on your Financial Report interface. Click the link to access your documentation site.
Documentation Site Features:
Interactive navigation through report sections
Expandable charts and visualizations
Organized by your analysis objectives
PowerPoint Download: If you selected PowerPoint generation, click the download button to save the presentation file.
Documentation site links are protected by domain whitelisting. Only users with email addresses from whitelisted domains (configured by your administrator) can access shared reports.
To Share:
Copy the report URL from your browser
Send the link via email or include in meeting materials
Recipients access the report if their domain is whitelisted
Downloaded PowerPoint files have no access restrictions and can be shared via email, file sharing services, or printed for meetings.
Share links only with individuals who need access
Match detail level (Executive vs. Comprehensive) to your audience
Verify external stakeholders' domains are whitelisted before sharing
Remind recipients that reports contain confidential information
Use the feedback box on your report page to provide input on what worked well or what could be improved.
Example Feedback: "Dive deeper into the Q3 one-time restructuring costs."
If the report needs adjustments, generate a new report with modified parameters:
Return to Financial Report from the action menu
Adjust objectives, upload additional data, or change output options
Click "Start Analysis"
Common reasons to regenerate: refining objectives, correcting data, changing detail level or language.
Note: Each regeneration creates a new report. Your original report remains accessible via its link.
Monthly Management Updates
Data: Current month P&L, YTD P&L, budget comparison
Output: Comprehensive documentation site, Executive PowerPoint
Board Meeting Preparation
Data: Quarterly financial statements, key metrics
Output: Executive documentation site, Executive PowerPoint
Year-over-Year Analysis
Data: Full year P&L for both years, balance sheets
Output: Comprehensive documentation site, Comprehensive PowerPoint
Profitability Analysis
Data: Revenue and cost data by segment, customer profitability
Output: Comprehensive documentation site
Risk Reporting
Data: Financial statements, aging reports, key metrics
Output: Comprehensive documentation site, Executive PowerPoint
Annual Planning Support
Data: Multi-year historical financials, trend data
Output: Comprehensive documentation site, Comprehensive PowerPoint
Data Preparation:
Use clean data with consistent formatting and clear column headers
Include comparative data (budget, prior year) for meaningful analysis
Name files descriptively (e.g., "2024_P&L_Actual_vs_Budget.xlsx")
Objective Setting:
Be specific: Instead of "Analyze expenses," write "Identify which expense categories exceeded budget in Q4 and recommend corrective actions"
Focus on 3-5 most important objectives to avoid diluting the analysis
Mix strategic and tactical questions for balanced insights
Output Selection:
Match detail level to audience: Executive for board/management, Comprehensive for finance teams
Generate PowerPoint only if you plan to present; use documentation sites for ongoing reference
Review and Iteration:
Expect to refine objectives and data based on initial results
Always provide feedback to improve future reports
Document successful configurations for recurring reports
Q: What file formats can I upload? A: Any but examples are: CSV, XLS, and XLSX files.
Q: Is there a limit to file size or number of files? A: No enforced limits. Multiple files of any size are supported.
Q: How long does report generation take? A: Typically 20-30 minutes.
Q: Will I be notified when my report is ready? A: No. Check back in Verifi after approximately 30 minutes.
Q: Can I continue working while my report generates? A: Yes. The analysis runs in the background.
Q: Can I edit the report after it's generated? A: No. Request regeneration with modified parameters if changes are needed. Downloaded PowerPoints can be edited.
Q: Who can access my generated report? A: Documentation site links are restricted to whitelisted domains. Downloaded PowerPoints have no restrictions.
Q: Can I generate multiple reports? A: Yes. Each report remains accessible via its unique link.
Q: What's the difference between Executive and Comprehensive detail levels? A: Executive provides high-level summaries for leadership. Comprehensive includes detailed analysis and supporting data for finance teams.
Q: Can I schedule recurring reports? A: No automated scheduling. Generate reports manually as needed.
Access Feature: Open Verifi → Select "Financial Report"
Upload Data: Drag/drop files
Set Objectives: Select examples and/or write custom objectives (3-5 total)
Configure Options: Choose output formats, detail levels, and language
Start Analysis: Click "Start Analysis" → Wait 20-30 minutes
Access Report: Click provided link to view documentation site and download PowerPoint
Share & Feedback: Share with whitelisted stakeholders, provide feedback, regenerate if needed
Document Version: 1.0
Last Updated: January 14, 2026
Published by: Verifi Finance ApS
Remember: Effective reports start with clean data and specific objectives. Iterate based on initial results to refine your approach for future reports.
